motivation
Recently when re-visiting a textbook, I re-encountered the birthday problem:
suppose there are n students in a class - what's the prob that at least two students in the class have the same birthday?
I remember the last time I encountered the ‘brain teaser’ was at least 4 years ago (I rarely looked at these trick questions designed for interview kings),
this time I am researching probabilistic models (as you can nominate some of the fancy names such as Bayesian nets) and found a clear and concise answer to the question, so I decided
to write it down - I can still recall the short and quick answer from that wall street book, but that’s totally ugly and evidence-absent. Rigorous proof is expected here.
An initial approach
As a logical person, you might come up with a fast experimentation: first order the students, say alphabetically. The traverse the students’ birthdays in that order. If you find a repeat birthday in the process, stop. This hints you that, there are at least 2 students in the class with the same birthday. If you go through the list of all n students without stop, then no students in the class share a same borthday.
As such, we define the following events for convenience:
- Rj: the event that the checking process stops with a repeat birthday at the jth student on the list.
- Dj: the event that the first j birthdays are different.
- Bn: the event that at least 2 students share the same birthday.
So we have:
i.e. the checking process stops with a repeat at some stage j<=n as you go through the birthday list.
The checking process can be represented by a sequential tree diagram as follows:
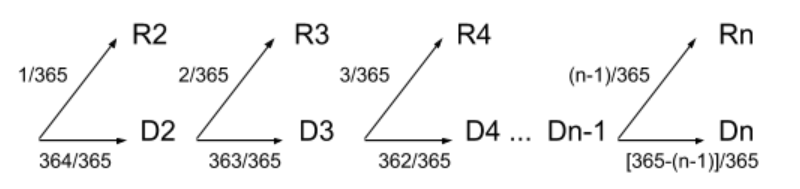
This diagram has been drawn with (conditional) probabilities accompanied, each subsequent prob was calculaculated conditioned on what happened in previous step. These probabilities were calculated based on the assumption that, no matter what the birthday of the first j-1 students, the birthday
of the jth student is equally likely to be any one of the 365 days in a year.
this assumption, or broadly any class of problem with such assumption, will be generalised later.
By attaching probabilities in the figure, we also ignore the effect of leap years and seasonal variation in birth rates.
As all Rjs are mutually exclusive, we have:
which is direct. Alternatively, the word ‘at least’ means we may approach it from its complement Dn - the event that all n birthdays are different:
we look at the second method. So how could we calculate P(Dn) - the probability that all n students have different birthdays? It turns out that:
so
Using the Bayes rule (or by the definition of conditional prob), the RHS can be written as products:
Let’s take a closer look at the ‘given’ conditions. Dn-1Dn-2…D3D2 for example, this set intersection just equals Dn-1 because
realising this, we re-write P(Dn) as:
Using the probabilities in the tree diagram, we have:
or equivalently:
so finally:
It’s a function of n - the number of students in the class. We can plot the probability model at discrete points:
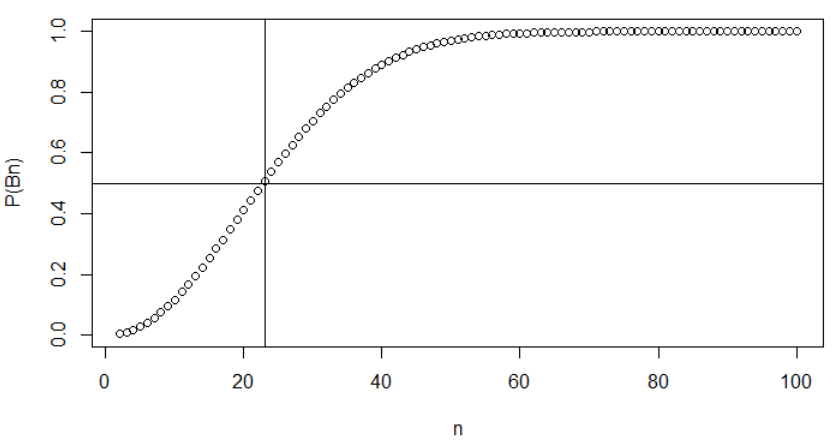
We can see how rapidly the probability of finding at least 2 students sharing the same birthday increases as n increases. An interesting point (and frequently asked question) is, when
would we start to get a probability bigger than 0.5? The answer is 23, as solved from the inequality approximately (numerically you can just substitute different values of n into the P(Bn) equation and get the n value when it exceeds 0.5 -
considering P(Bn) is in monotone increasing function of n):
When (n-1)/365 is small, we can simplify the P(Bn) expression as follows:
As ,
(where we used the approximation: log(1+z) approximately equals z for small z)
we have:
,
which gives:
This appriximated formula of P(Bn) can also be solved for n, answering P(Bn)>=0.5.
As a comparison, the probabilities P(Rj)s in the first (direct) method are plotted in the following figure (when n=100):
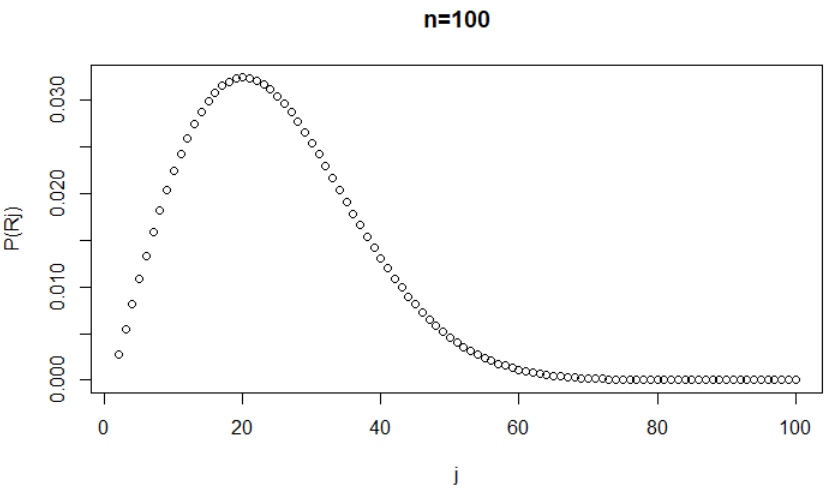
Sum all the bins up in the above figure gives the P(Bn) when n=100 (corresponding to a single point in the P(Bn) figure). Note the shape of P(Rj) is totally determined by N, not by n.
Another interesting point is, we can see from the direct P(Bn) expression that
which infers that, the P(Rj) curve is actually the derivative of the P(Bn) curve.
Generalisation
The above described case is a sub-case of the general problem of a senquence of events, in which each event is equally likely to result in any one of N possible outcomes (each outcome with occuring prob=1/N), no matter what the results of previous events (in the above case, N=365).
An common example is, there are N tickets in a box and you are asked to repeatedly pick a ticket with replacement from it. Or you are spinning a roulette wheel with N pockets.
Repeating the same derivation process, we arrive at:
(assuming N is large)
where P(Bn) denotes the probability that there are at least 2 events come out with the same results, when repeating the experiment in a pool of n samples and each experiment outcome are equally likely (1/N).
We see that P(Bn) is a monotone increasing function of n, i.e. the more samples in the pool, the more likely we are to observe at least 2 identical items.
Again, a natural question to ask is, how large does n have to be to have at least a 50% chance of a repeat by n? To answer this, we set the above P(Bn)=0.5, which is:
we arrive at:
Let’s have a quick verification: substitute N=365 into the above formula we got n=22.48, which is consistent with previous analysis (the error comes from the approximation where 365 is finite).
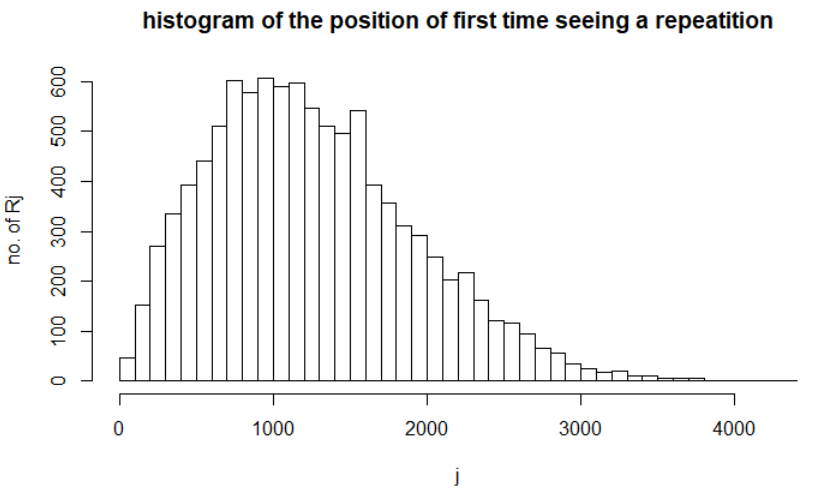
As another example, we randomly genertae a series of 6-digit numbers using random number generator. The outcome of each generation has flat (uniform, equally likely) probability to be
one of the N=1e6 possible numbers represented by a 6-digit number. While we can safely state that N is reasonably large, so we use our approximate formula n=1.177sqrt(N) to conclude that,
to observe a repeated number (any number) in a randomly generated series of 6-digit numbers with 50% chance, we need to generate at least n=1177 numbers randomly.
To verify this, simulations are carried out as follows: we used a pseudo-random number generator to generate a 6-digit number and record its first time (the position) of seeing a repeated sample. This experiment was repeated for 1e4 times,
and the histogram of the position was drawn in the following figure:
This is
Conclusion
Probability is a measure of the chance of occurence of events. ‘since it has a flavor of set theory, calculus, analysis, algebra, there is a tendency to treat probability as a branch of mathematics’
If we take the long-run frequency intepretation of probability.
Thanks, Yong 30/10/2020